Chart reading using a candlestick is a basic yet important skill for any trader or person who wants to trade or invest in any stock.
for chart reading, you need to understand the types of candlesticks for price action as candlestick is the most used and An important part of trading charts.
Before studying types of candlesticks we need to what is candle.
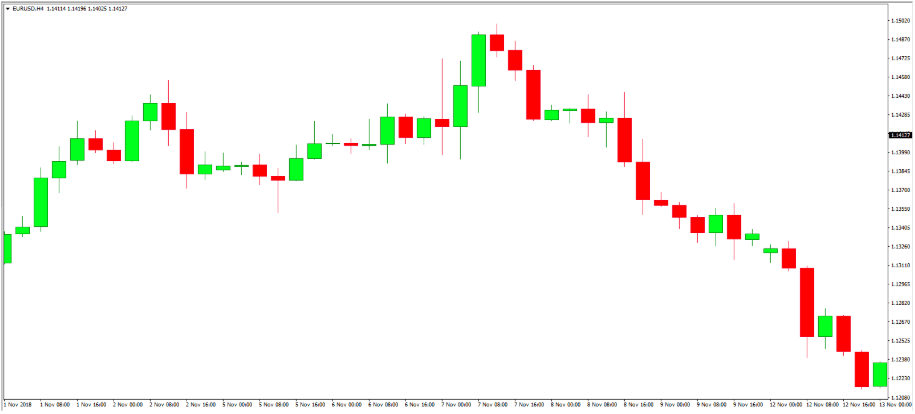
Candle shows the price behavior of any stock at that particular time as shown in the below example.
In this example, you can see a chart of some random stock and you can see different candlesticks in it which forms that chart.
Now till here, you are familiar with what is chart is and how candlesticks play a major role to form a chart.
Now we will understand the anatomy of candlesticks. As shown in the above chart there are two types of candles one is in Green and the other shows in Red. why is the chart shown in two color candles?
The Green candle is a bullish candle that shows strength in price and the Red candle is a bearish candle that shows weakness in price.
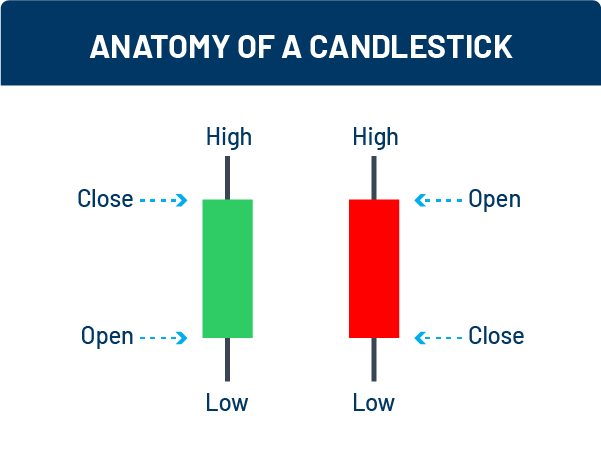
Candlestick Anatomy
In the above image, you can see the anatomy of the candle.
- A candle consists of 4 Price points Open, High, Low, Close
- In which the opening of the candle is where the candle starts to form. Where candle finish is consider as close of that candle
While the candle is being formed at that time the highest point it touches is considered as High of that candle, similarly the lowest price where candle touches are considered as Low of that candle.
The Portion between the open and close of the candle is the body of the candle. The portion which shows the High and Low of the candle is as Wick of a candle. It is also known as a shadow.
The important thing to keep in mind is The close of the green candle is below the open point and the Close of the green candle is below its open price.
There are different types of candle formation
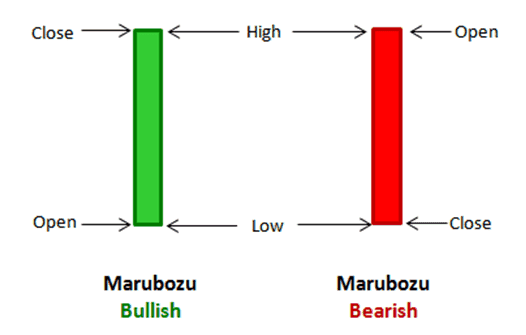
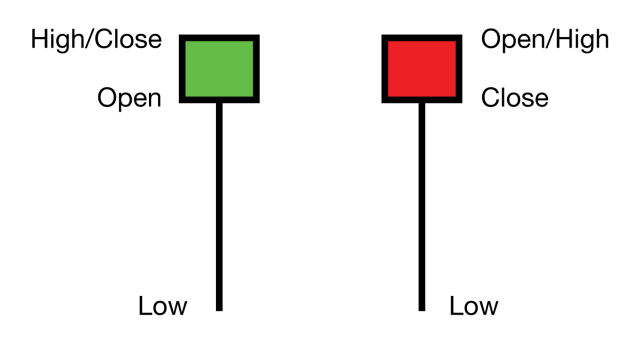
1) Bullish marubozu candle:
Marubozu is the Japanese term for candlestick formation. In This, The Open price of a candle is also the Low of that candle, and the Close of the candle is High if candle which means the candle has no wick or shadow. Practically this type of perfect marubozu candle is rare to form as marubozu candle means bullish candle having more than 90% of the body and if the wick is present it is very small.
2) Bearish marubozu candlestick
In This, The Open price of a candle is also the High of that candle, and the Close of the candle is low of the candle which means the candle has no wick or shadow. Practically this type of perfect marubozu candle is rare to form as marubozu candle means bullish candle having more than 90% of the body and if the wick is present it is very small.
3) Hammer candle
You can see in the below image these candles are bullish hammer candles as it looks like a hammer. Now you will be surprised how the second red candle considers a bullish hammer.
In this type of candle, the wick is 2-3 times larger than the body.
The reason behind that is the candle consists of the participation of bulls i.e Buyers and bears i.e sellers. So you can see that the green candle after opening its first travel downwards. It means sellers are stronger in it. While closing buyers take charge and close that candle above the open price that is why it’s in green. The wick shows rejection from buyers as buyers doesn’t want to let go price downward.
But the second candle closes below the opening price. The rejection from buyers is stronger as you can see the size wick which shows rejection from buyers.
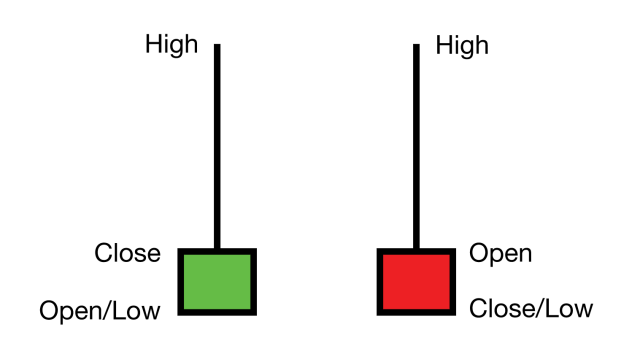
4) Inverted hammer candlestick
As you can see below the image these candles are bearish hammers or inverted hammer candles. Now you will be surprised how the first green candle is a bullish hammer candle.
In this type of candle, the wick is 2-3 times larger than the body similar to a hammer candle.
As You can see that the green candle after opening its first travel upward which means buyers are stronger in it, but while closing seller takes charge and close that candle above the open price that is why it’s in green but the wick shows rejection from sellers as sellers don’t want to let go price upward.
in the second candle, it closes below the opening price. It is clear that the rejection from sellers is stronger. You can see the size wick which shows rejection from buyers and finally it close in red.
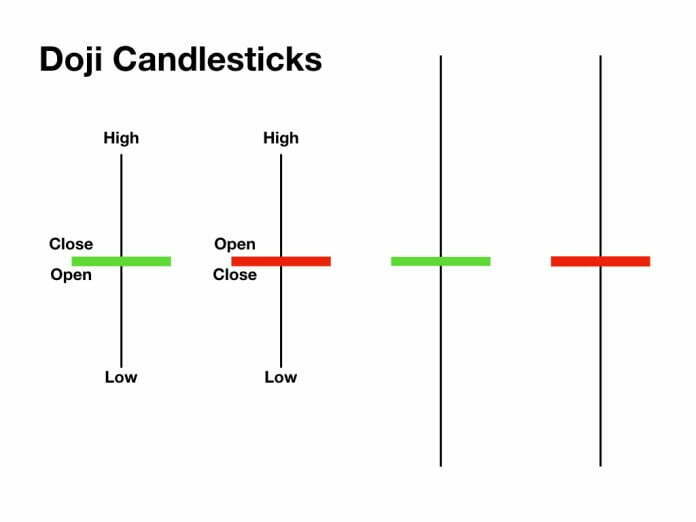
5) Doji candle
In Doji candle candlestick, the size of the body is nearly negligible. The candle should close with the body in between and wicks from both sides of the candle. Doji candle shows the indecisiveness in price action. It shows buyers and sellers are equal but can strongly decide their move.